StatisticSports
Quality data service since 2013
Game page
Essential tools for analyzing the games. Compare teams form, head to head matches and games against mutual opponents to find the edge in front of bookies. 5 years of a statistical database in your hands.
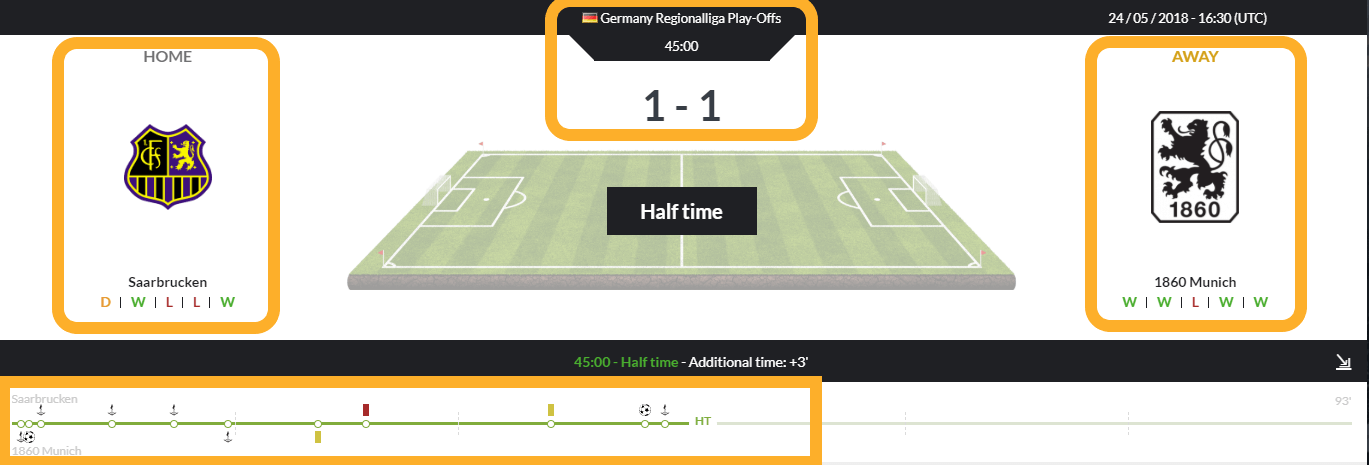
Interactive game actions pitch
Follow the game in-play from our actions pitch where we provide:
- Scoreline.
- Team names.
- Interactive gameplay flow.
- All important game action.
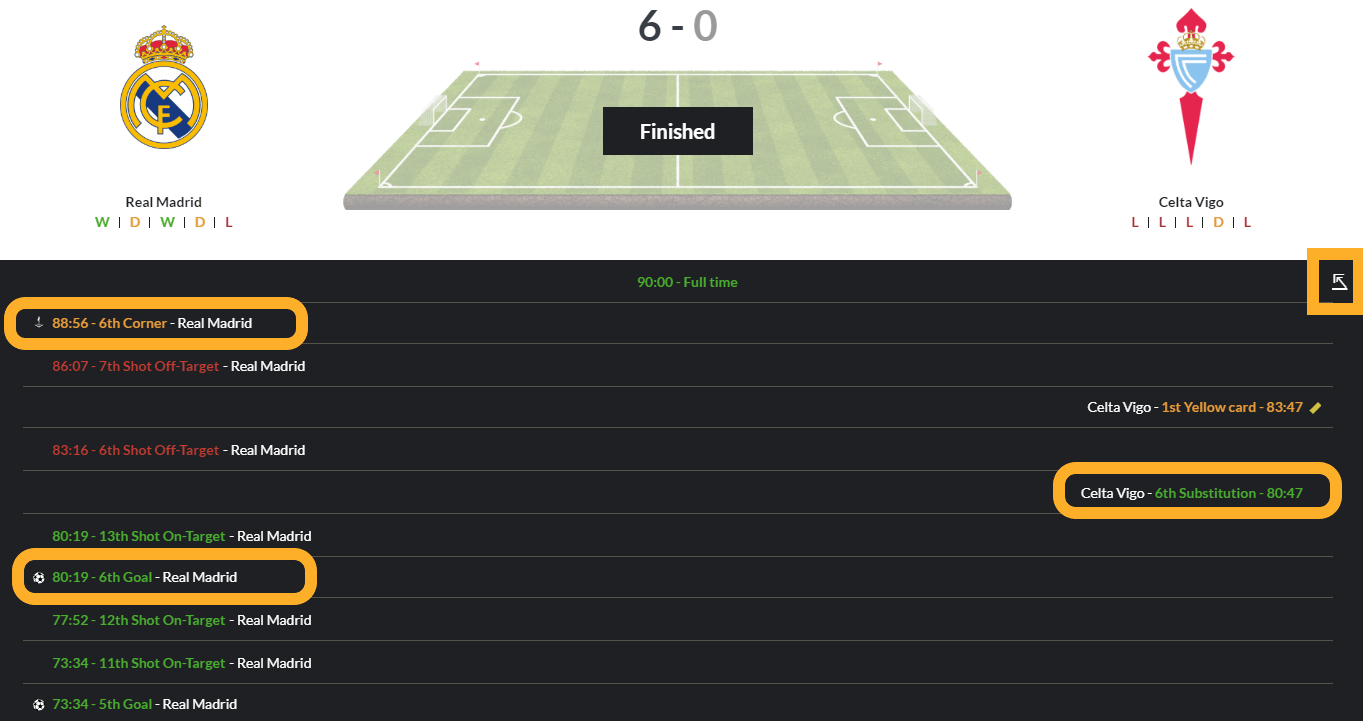
Game actions timeline
A lot of websites offer simple statistics but only our tool offers game actions timeline for already finished games and also during in-play. Game actions timeline allows you to check when exactly particular actions happened in the game and in what order.
You placed a stake on 2nd goal or next corner and closed the game accidentally.
You can check the order of actions easily from the timeline.
The timeline shows you:
- Goals.
- Shots on and off target.
- Cards.
- Corners.
- Substitution times.
- Added additional time.
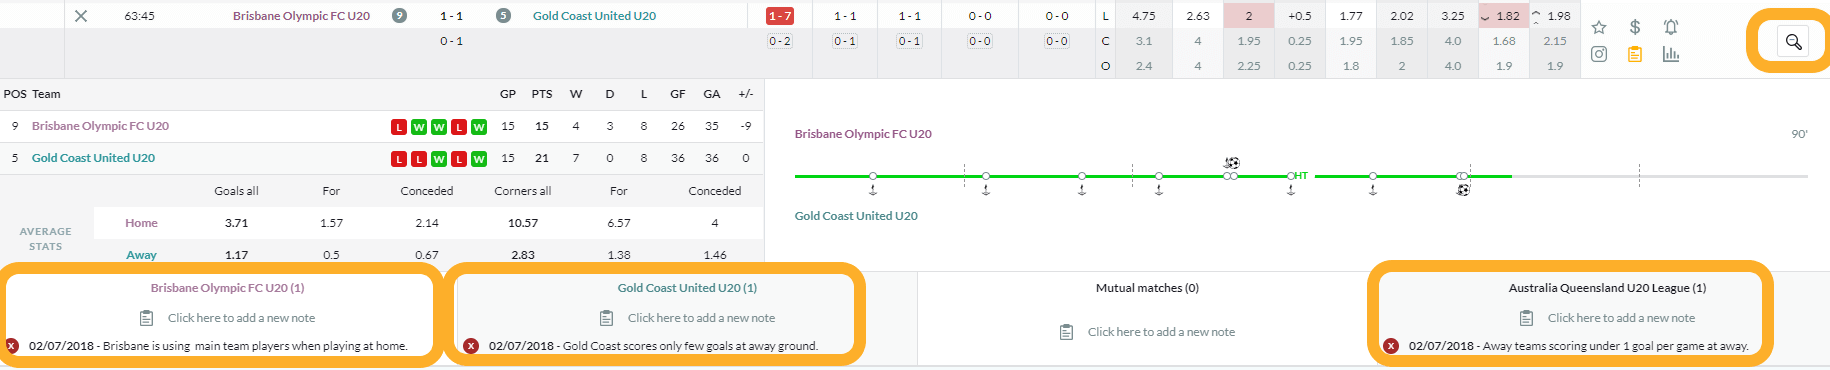
Team/game notes
Add additional information to teams and games.
Our tool allows you to add team to your favourites with added notes - This saves you from hazzle to keep additional spreadsheets.
Add team news like:
- Missing players because of the red card.
- Missing players due to injury.
- Added players during the transfer window.
The tool saves all important information you have added and offers you quick access to this information.
Also, every team with notes have a mark on the live games page and when the game starts, it comes into your favourites list in order not to miss the game.
You can also add game notes - for example, when the final result didn't reflect the in-play stats or there were, for example, a bad weather, a lot of red cards which influenced the final result of the game.
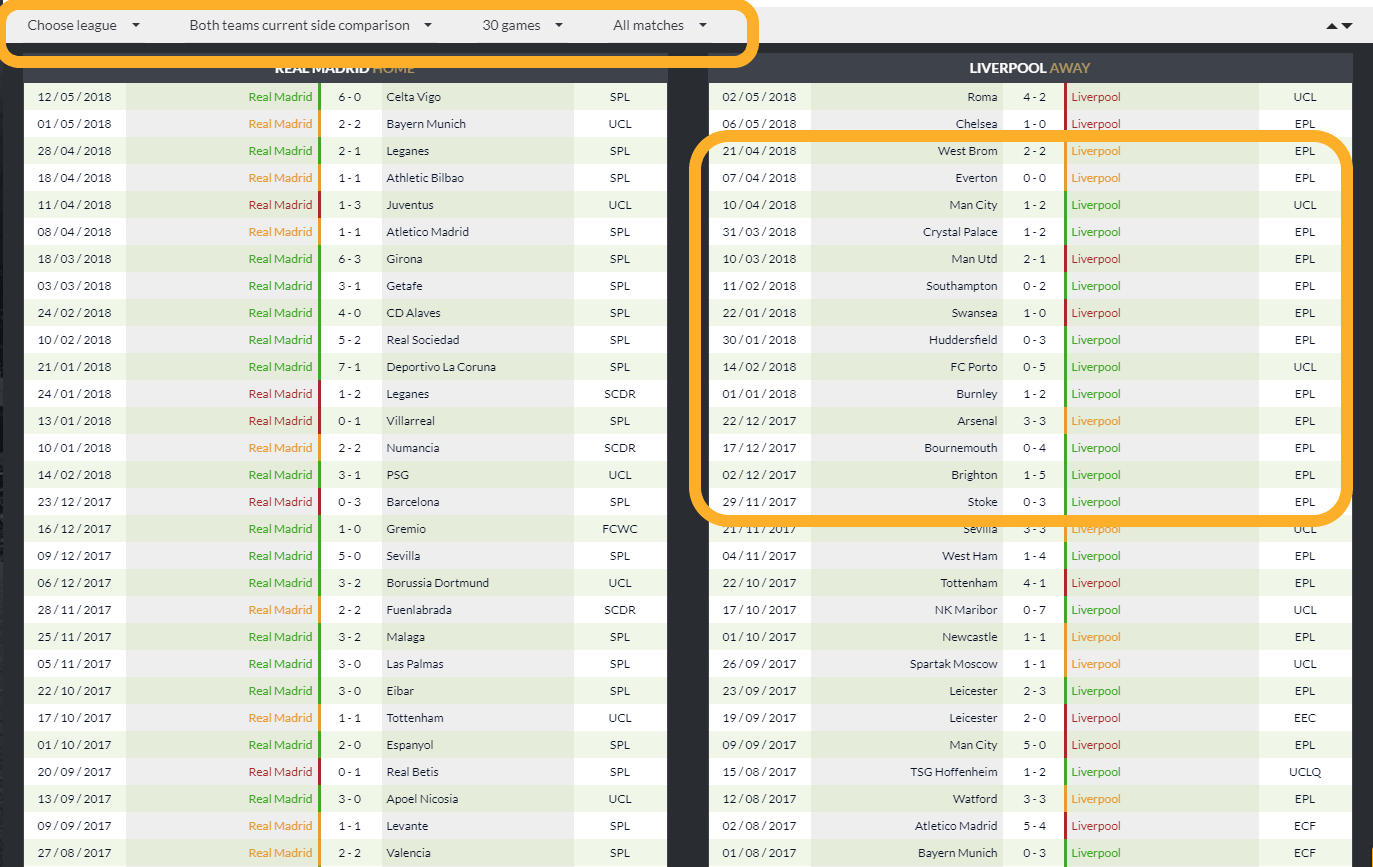
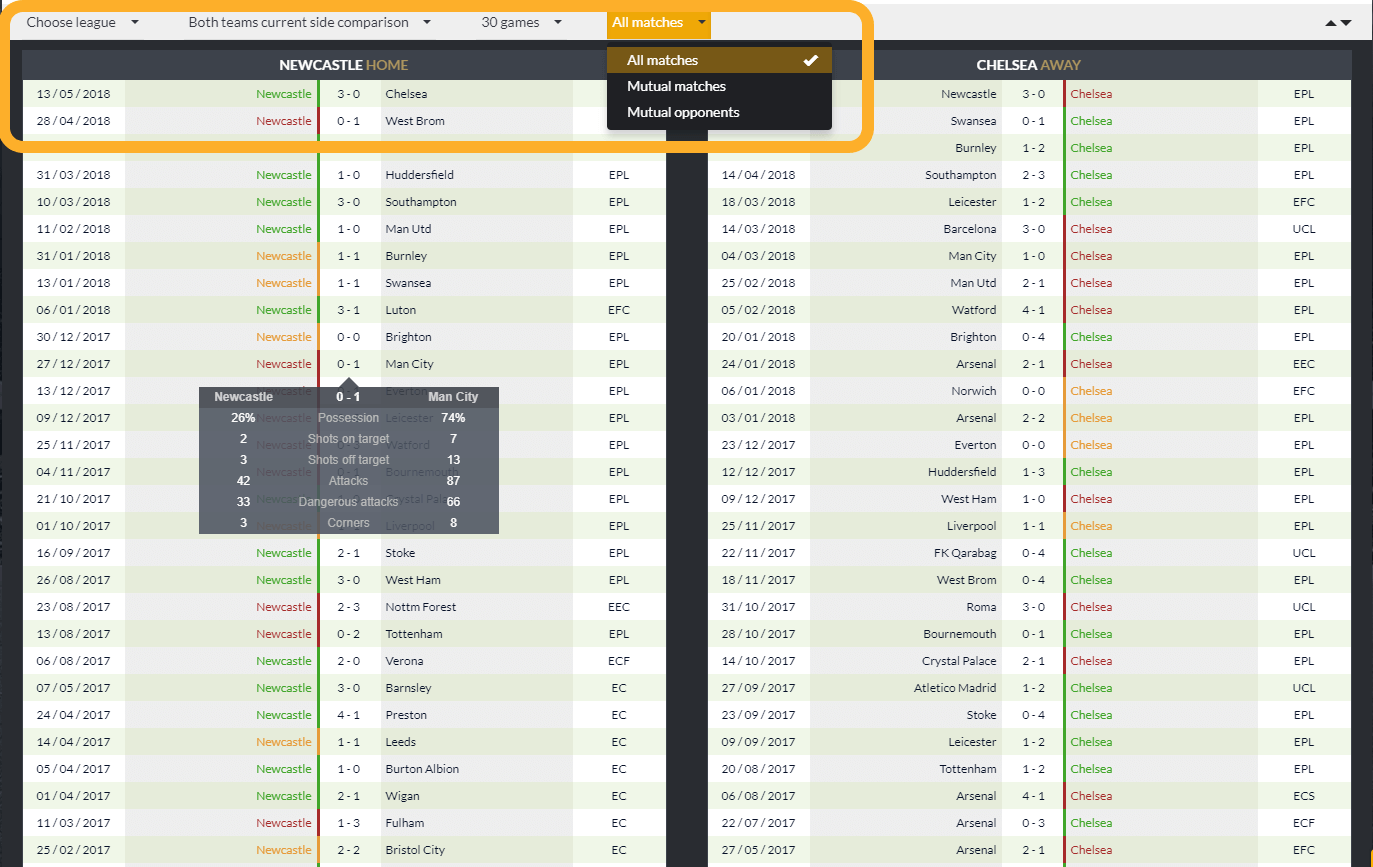
Recent games comparison
There's also easy to use option to check teams recent games results.
Tool have several different options to check the games and sort them.
When clicking on:
- Choose league - Here you can change the leagues. For example, show only games played in a local league or only in a cup.
- Both teams current side comparison - This means that tool shows you only home games for the current home team and away games for current away team. You can also remove the filter by clicking on None, then the tool shows you all recent games. You can also set the tool up to show you both teams home games or away games only.
- 15 games - There you can order the amount of games to be shown.
- All matches - There are 3 options. All recent games, only mutual matches or mutual opponents.
Sortable in-play statistics section
On game page, we offer in-play statistics comparison tool for the games.
The tool has 2 blocks for easier use.
First is for the first half and second is for the second half.
On top of the tool, you can use sliders to compare for example in-play stats from 30 to 45 minutes or stats from 60 to 75 minutes only. Blocks also make it easier to quickly compare only first and second half in-play stats.
Mutual opponents
sorting
Checking games against mutual opponents haven't been as easy as it is now thanks to our tool.
Our tool shows you with a click of a button all recent games teams have played against same opponents.
This gives you extra angle to compare teams form and real ability.
It's especially useful when there are first games in the league and teams haven't being played against each other yet, but have played against same teams in the league.
Head to head matches
Head to head comparison is essential and once again our tool offers this option easily and quickly.
Compare teams previous games against each other and also:
- If the odds dropped.
- How the game was played according to in-play statistics.
Judge if the result was fair or one team were overperforming and the final result was against the odds.
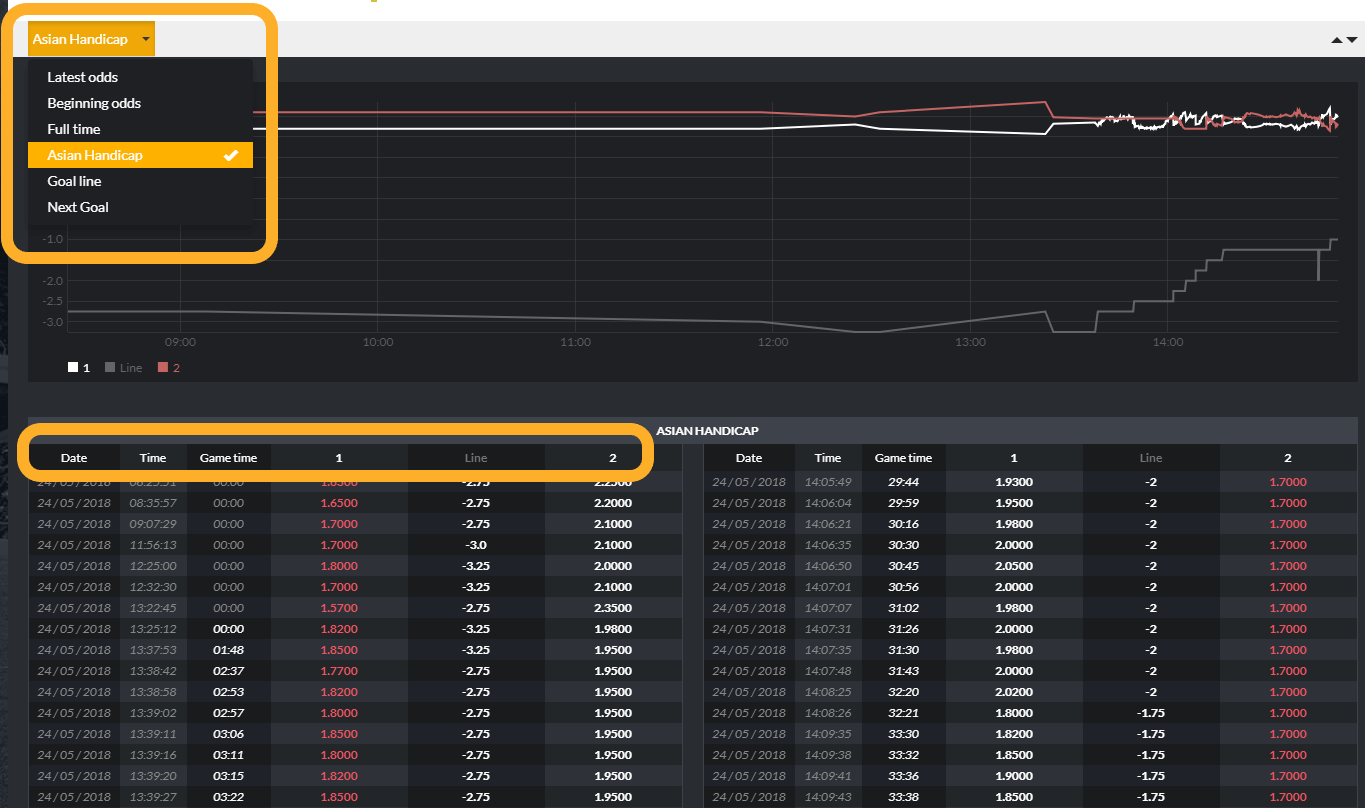
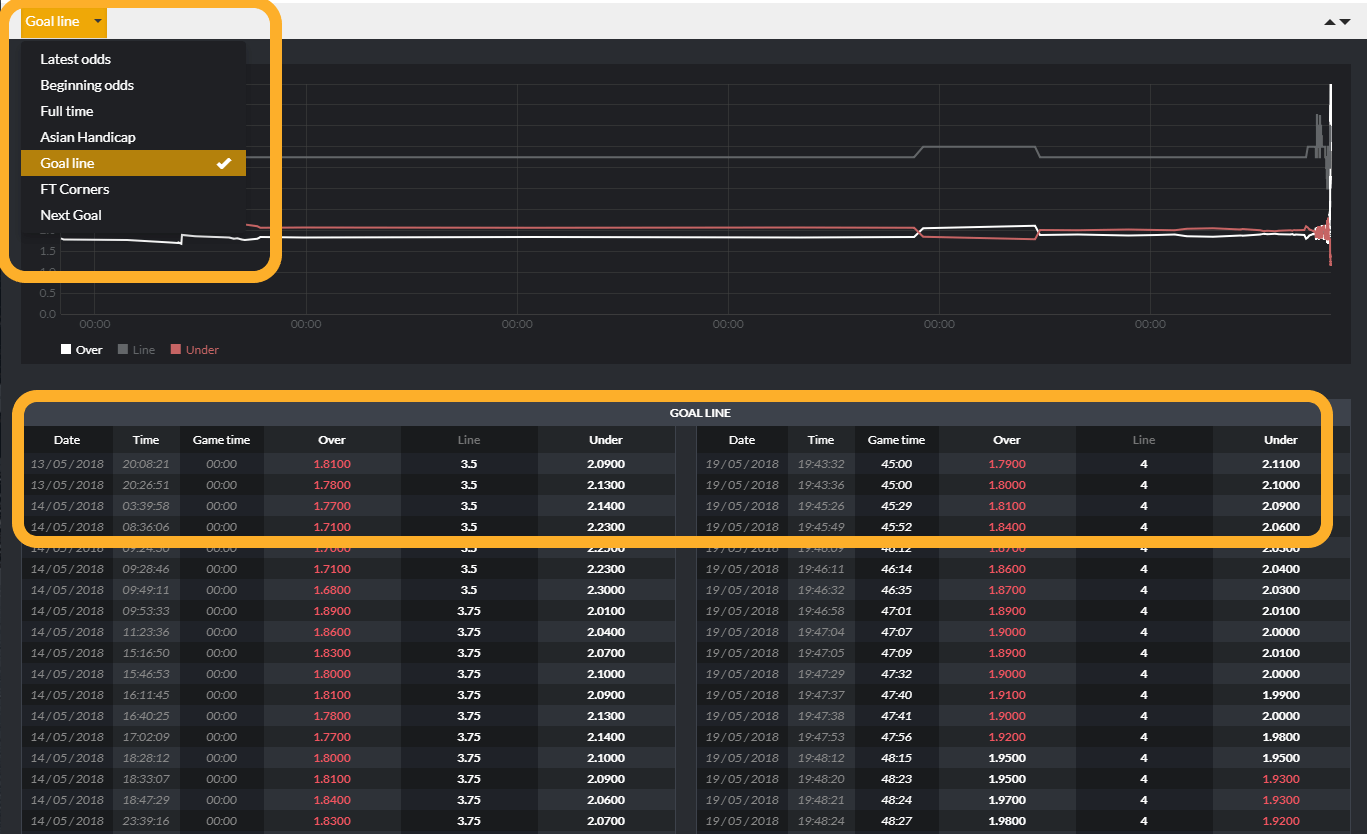
In-play and pre-game odds
Our tool saves pre-game and in-play odds for different markets:
- 1x2 odds - Home win, draw and away win market odds with odds movements.
- Asian handicap odds - all lines and line changes with odds movements.
- Goal line odds- all lines and line changes with odds movements.
- Corners - again, all lines with odds movements and also line changes.
We offer these odds in a graph and in a table.
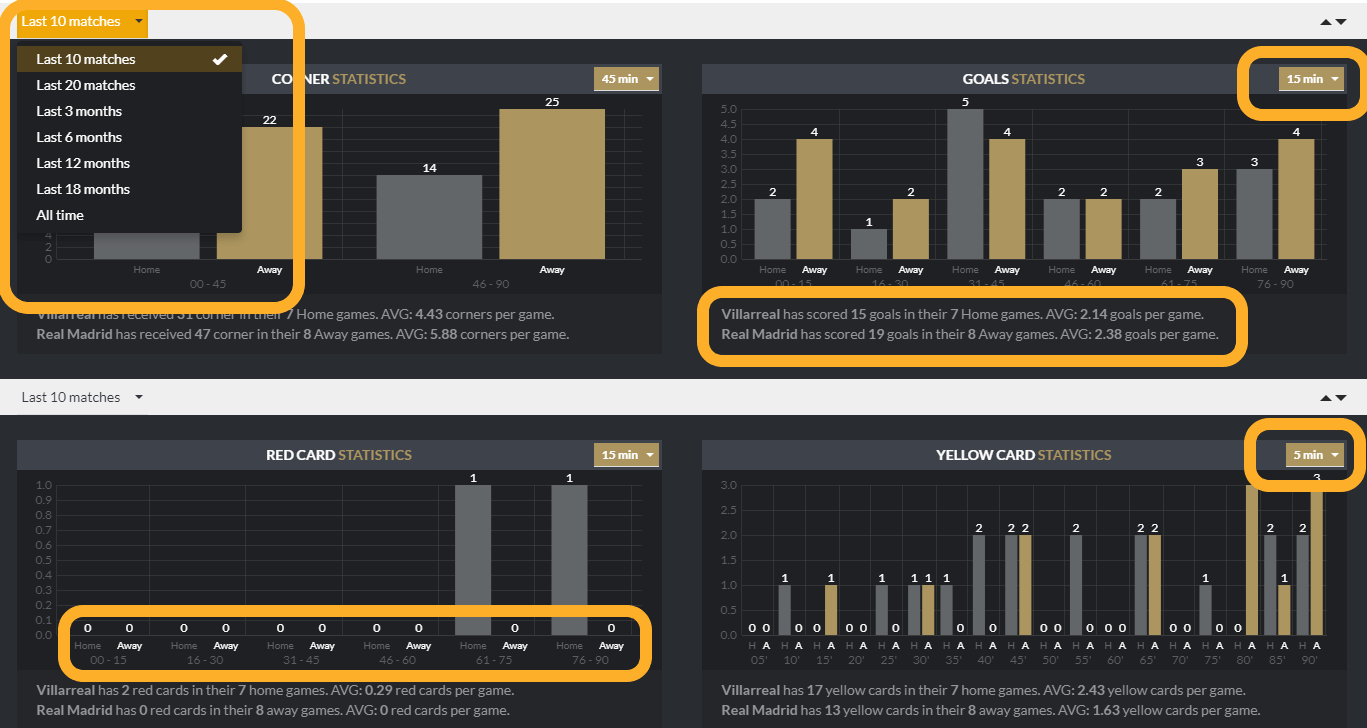
Teams average statistics
Here we show you main average stats for the teams:
- Corners - Sortable by the number of games from 10 matches to games played in last 18 months. You can sort stats by 15 minutes period to 45 minutes period. Latter helps you quickly to understand if the certain team tends to get more corners in first or second half. We offer also easy to understand team averages. Home team and away team average corners per game when playing at home or away ground.
- Goals - Same logic as with corners. You can sort the stats by the number of games or split the graph by game time. Handy again when you want to see information about when the team scores more. Under the graph, we offer the averages. How many goals the home team scored in recent x games at home and same for away team.
- Yellow cards - Cards statistics can also be sorted by the amount of games and split them by game time. Under the graph there's
easy to follow team averages. - Red cards - Cards statistics can also be sorted by the amount of games and split them by game time in the graph. Under the graph, there's easy to follow team averages.
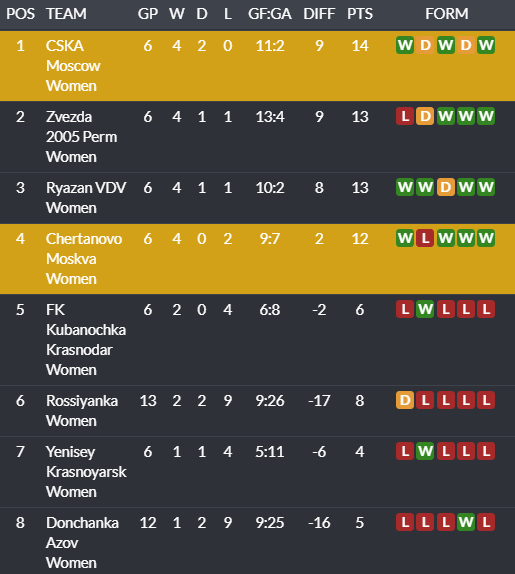
League tables
Don't waste your time and get quick information about:
- Teams league position.
- Home form.
- Away form.
- Goals difference.
Teams league position is vital information and has to be quickly accessible.
At the end of the seasons, some teams need more points than others and the league table is the best place to get a quick overview about which team should be more motivated to win this game.
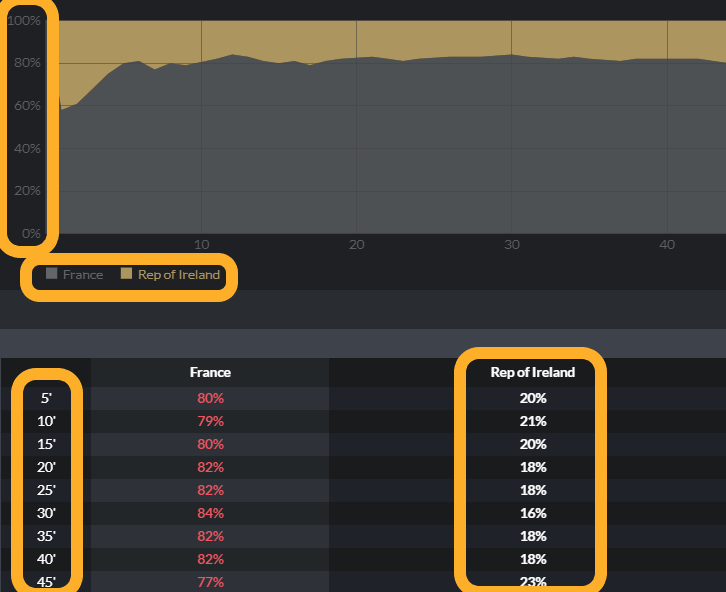
Possession changes tables
Possession changes are brought to you in a graph and in a table.
The graph helps you visually spot when the team tends to dominate the game and build their play.
From the graph, it's also easy to spot the time period when particular team tends to dominate in ball possession.
Possession table gives you an option to check the possession % for teams and is also separated by game time, from 5th minute to end of the game.
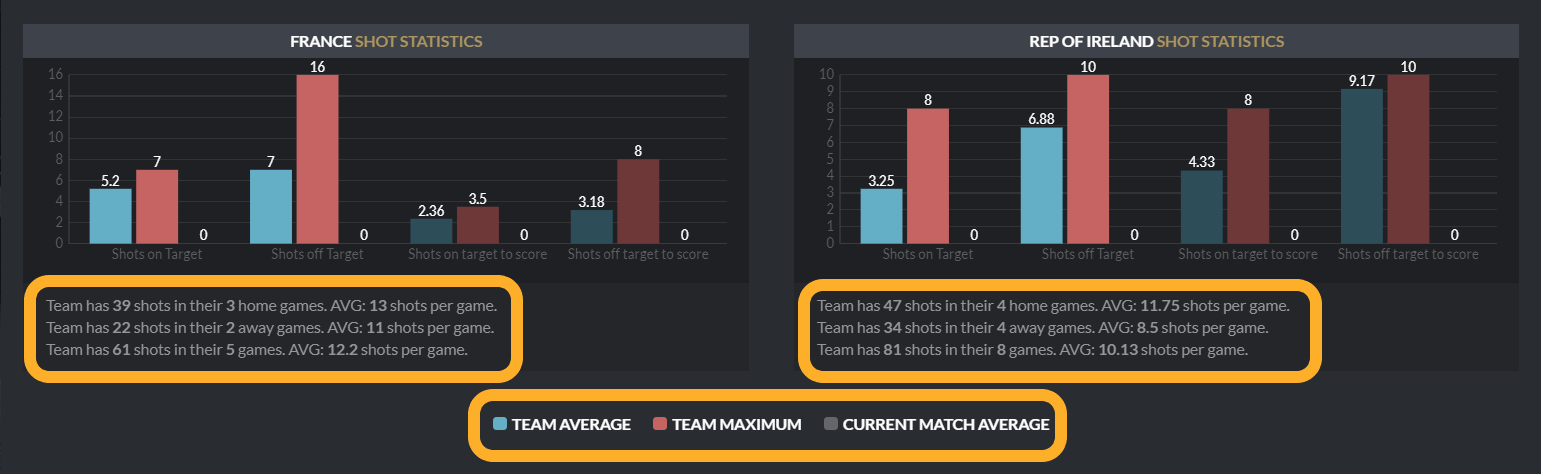
Shot statistics graphs
Inevitable graphs judging teams strengths when attacking.
Graphs can show you averages from last 10 matches to matches played in last 18 months and including all the games in the database.
There are 2 graphs for each team. Information in graphs:
- Shots on target - Shows user 3 different columns of shots on target averages. Team average in x games in the first column. Teams maximum shots on target in the second column and current shots on target in this certain game, stats updated in live.
- Shots off target - Again, 3 different columns. Team average shots off target, maximum shots off target and current in-play shots off target.
- Shots on target to score - The first column shows team average shots on target for scoring a goal. The second column shows teams maximum amount of shots on target before scoring a goal. The last column shows current game shots.
- Shots off target to score - The first column shows team average shots off target for scoring a goal. The second column shows teams maximum amount of shots off target before scoring a goal. The last column shows current game shots.
Under the graphs there are 3 important averages brought out:
- Teams shots total and averages at home.
- Teams shots total and averages at away.
- Teams shots total averages at home and away.
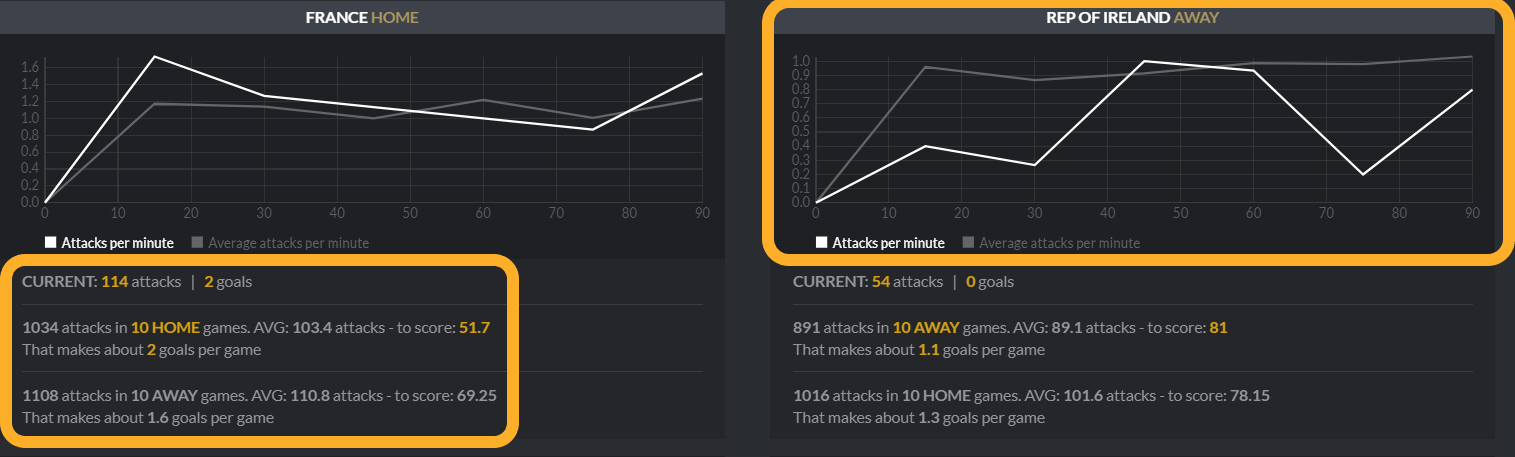
Attacks and dangerous attacks graphs
Easy to follow, but very important graphs to judge when the particular team attacks more.
We offer 2 different graphs here for both, home and away team:
- Attacks and average attacks per minute.
- Dangerous attacks and dangerous attacks per minute.
Both graphs allow you to judge once again when certain team tends to dominate the game.
Under the graphs you will see 5 important statistics:
- Current attacks and goals - Attacks count and goals count are updated live, so these are real-time stats.
- Attacks and dangerous attacks average at home - Shows you home or away team averages and how many attacks and dangerous attacks they need on average to score a goal.
- Goals per game at home - Shows you average scored goals when playing at home.
- Attacks and dangerous attacks average at away - Shows you home or away team averages and how many attacks and dangerous attacks they need on average to score a goal.
- Goals per game at away - Shows you average scored goals when playing at away.
Você pode ter o pacote completo para 7 período de teste para livre